RSI-Exam

Benchmarking Recursive Self-Improvement through Executable Research

Introduction

What RSI-Exam measures

RSI-Exam measures whether a language-model agent can improve the executable method that solves a task or the harness that drives a frozen model. It studies improvement of that working artifact through sustained experimentation, not modification of the model's weights.

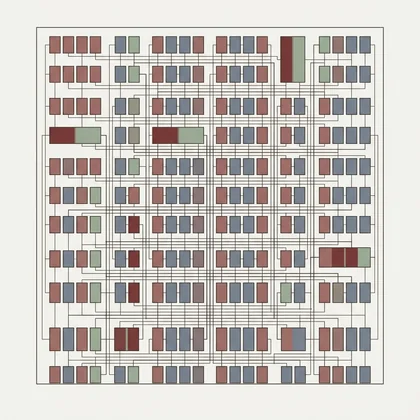
The first release applies these principles across six domains. RSI-Exam 0.1 contains 88 tasks: 35 public and 53 private. They span AI models and agents, systems and hardware, physical sciences and engineering, optimization, life sciences and medicine, and finance, law, and business, while retaining the metric and executable workflow of each field.

Benchmark

The RSI-Exam benchmark

How an evaluation works

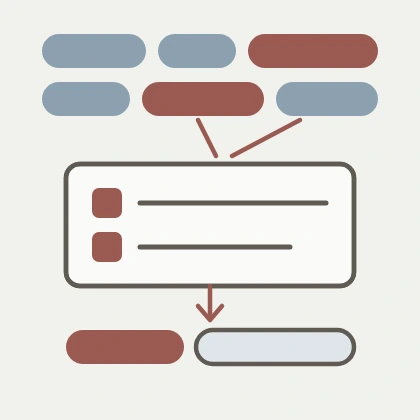
Every RSI-Exam task begins with a working, executable artifact that produces a valid but improvable result. Depending on the task, that artifact may be a method that solves the problem directly or a harness that directs a frozen model. Examples include a query optimizer restricted to nested-loop joins, a gate-sizing method that assigns maximum drive strength to every instance, and a wind-retrieval method that solves only part of the governing system. Starting from a functioning artifact rather than an empty repository requires the agent to diagnose and improve an existing approach.

That inherited artifact becomes the starting point for one fixed-budget evaluation run, or rollout. Within its time and resource limits, the agent modifies the artifact, evaluates candidate versions on the visible set, and saves numbered versions as its approach evolves. At the end, it submits one executable artifact rather than an answer or a precomputed prediction file. The verifier then runs that artifact unchanged on the hidden set in a sealed evaluation environment.

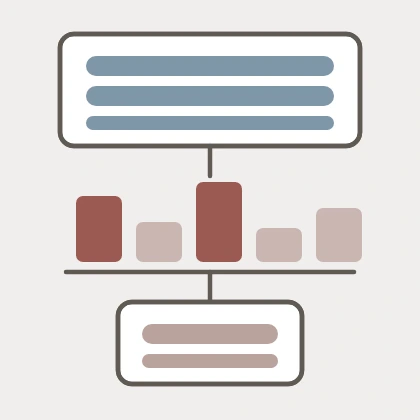
The two sets serve different purposes. The visible set guides experimentation and method selection; the hidden set tests whether the final improvement transfers beyond the data or cases available during development. Using the same set for both would conflate generalizable progress with adaptation to the development cases. The task score therefore comes from the hidden-set rerun, separating transferable improvement from a high visible-set score.

Construction and quality control

That protocol is trustworthy only if a better hidden-set result represents a genuine, generalizable improvement rather than leakage, execution noise, or a defect in the benchmark. RSI-Exam therefore builds and reviews every task through four stages: problem selection, environment construction, score calibration, and end-to-end review.

How a task is built: 40+ domain experts propose the problem, 10 developers build the images and debug the agent loop, 90+ rubric checks audit it, agent trajectories are run and read, and 88 active tasks enter the benchmark; tasks that are too easy or need a fix return to their author.
Each task passes through four stages before entering the bank. Candidates that an agent already solves are removed; tasks that need revision return to their author with the trajectory attached.

Problem selection. We begin from published research problems with an executable baseline and a quantitative objective. A candidate must leave meaningful headroom beyond the inherited method, support multiple rounds of substantive experimentation, and admit evaluation on private data. Only problems that satisfy these requirements are converted into benchmark tasks, and candidates already solved by the pilot agent are excluded.

Environment construction. Each selected problem is packaged into two isolated runtime environments: a development environment visible to the agent and a sealed evaluation environment used by the verifier. Any author-only reference implementations and calibration records remain outside the agent-visible surface; they are supporting artifacts, not a third runtime environment. Resource limits and the submission interface are made explicit. The required deliverable is an executable method, not a stored answer or prediction file.

Within the sealed evaluation environment, a trusted parent process loads the protected targets and keeps them outside the child environment before importing the submission. The child receives only the permitted evaluation inputs and a narrow prediction interface; network access and retraining inside the verifier are disabled. Score calibration begins only after this isolation boundary is fixed.

Score calibration. Landmarks are measured reference points used to map a task's native metric onto the common scale. Every landmark must be supported by the frozen task definition. A landmark derived from a method must also correspond to a concrete run in the evaluation environment. Reference methods use the same verifier as submissions; the task's aggregation rule, landmarks, and score map are then frozen for the release. The mapping is described under Scoring and normalization below.

End-to-end review. Review covers the problem definition, constraints, data split, leakage surface, reference methods, and verifier implementation. The completed task then undergoes a long-horizon pilot that checks four properties:

Only tasks that pass all four stages enter the release bank. A failed task returns to the relevant stage for revision, and an unresolved candidate is removed.

Task bank

The RSI-Exam 0.1 release bank contains 88 tasks across six domains, comprising 35 public and 53 private tasks. Together they span AI, science, engineering, systems, medicine, and professional decision-making while retaining the native metric and executable workflow of each field.
Scoring and normalization

Anchors. The inherited Starter is fixed at 0.00. When a genuine mathematical, theoretical, or oracle Upper bound exists, it is fixed at 1.00. When the task author provides a strong frontier solution, we verify its quality with the same sealed verifier, correct the calibration when necessary, and use the resulting measured performance as an optional Frontier-calibrated SOTA anchor at 0.60.

Mappings between anchors. We use linear or log-linear interpolation between finite anchors. When no finite upper bound exists, we use an exponential tail so further gains still receive credit while the score approaches, but never reaches, 1.00. Each task’s anchors and mapping are fixed before comparison.

Experimental setup

Experimental setup

We hold the tasks, verifiers, and scoring procedure fixed and vary the model-agent system. The experiment measures both the final method produced by each system and the research process that produced it.

Models and agent harnesses

A rollout begins with a single agent working alone in a fresh container that holds the task environment and inherited method. When the run ends, the verifier re-executes the final method on the hidden split and computes its score. Each model receives one rollout per released task, so the results compare aggregate capability but do not estimate within-model run-to-run variance.

ModelAgent harnessReasoning effort
Opus 5Claude Codemax
GPT-5.6-solCodexmax
GLM 5.3Claude Codemax
Kimi K3Kimi CLINot specified
Grok 4.6Grok Buildxhigh
GPT-5.5Codexxhigh
DeepSeek V4 ProClaude Codemax
Qwen3.8 MaxQwen Coderxhigh
Gemini 3.7 FlashAntigravity CLIhigh

Execution and records

Execution isolation. Every rollout runs in its own Docker environment under the resource and time budgets declared by the task. The agent and verifier stages remain separate, and the container is destroyed after evaluation.

Network isolation. Container egress was restricted to the model provider API and, where required, its authentication host. Literature, external leaderboards, and package indexes were inaccessible. The Claude harness additionally ran with WebSearch and WebFetch disabled. No run used a skill library or MCP server, and all models received an instruction rendered from the same prompt template.

Interrupted runs. If an agent terminates early because of a timeout or another error, the verifier still evaluates the final method left in the container. A score of 0 therefore means that the method did not improve on the inherited baseline; it does not necessarily indicate a runtime failure.

Inspectable records. Each rollout preserves its resolved model configuration, timing, verifier reward, and complete version history. The history records each attempted method, the agent’s description of the change, and which versions were retained or discarded. Task pages are generated from these underlying artifacts, making every leaderboard result traceable to its research trajectory.

Analysis plan

The analysis proceeds from outcomes to mechanisms. We first compare mean normalised scores, then use within-task relative performance to ask whether model strengths vary by domain. Next, we measure how much visible-set performance transfers to the hidden set and describe how runtime, spend, and step count relate to outcomes. Finally, selected trajectories show how retained and discarded experiments accumulate into a final method. Aggregate comparisons use every task in the stated panel; analyses that require additional records report their smaller sample explicitly.

Results

Results and analysis

We first compare aggregate performance, then ask whether relative strengths vary by domain, whether visible-set gains transfer to the hidden set, and how resource use relates to the final result.

Overall performance

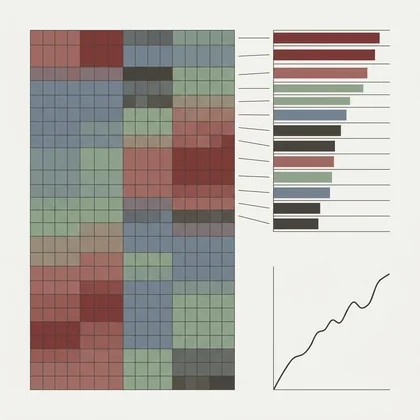
The leaderboard gives every task equal weight and averages its frozen normalised score across the 88 active public and private tasks. A score of 0.00 denotes the inherited baseline; where a task defines a frontier-calibrated reference, that reference is placed at 0.60. Opus 5 has the highest mean in this single-rollout panel, followed by GPT-5.6-sol and GLM 5.3. The aggregate mean also hides whether the same systems lead in every domain, which motivates the within-task comparison below.

Opus 5Claude Code · max
0.464
GPT-5.6-solCodex · max
0.433
GLM 5.3Claude Code · max
0.403
Kimi K3Kimi CLI · max
0.382
Grok 4.6Grok · xhigh
0.367
GPT-5.5Codex · xhigh
0.331
DeepSeek V4 ProClaude Code · max
0.322
Qwen3.8 MaxQwen Coder · xhigh
0.322
Gemini 3.7 FlashAntigravity · high
0.309

Relative performance by domain

Native rewards cannot be compared directly across tasks, so this view first places each run relative to the nine runs on the same task. The within-task z-score measures the distance from that task's mean in units of its observed spread: 0 is average for the task, a positive value is above average, and a negative value is below average. We then average those within-task values inside each domain.

Opus 5 GPT-5.6-sol GLM 5.3 Kimi K3 Grok 4.6 GPT-5.5 Qwen3.8 Max DeepSeek V4 Pro Gemini 3.7 Flash AI Models & Agents (18) +0.69 +0.24 +0.55 +0.18 +0.06 -0.30 -0.36 -0.68 -0.38 Physical Sciences & Engineering (19) +0.53 +0.89 +0.24 -0.01 -0.07 -0.28 -0.56 -0.29 -0.44 Optimization, Planning & Control (18) +1.12 +0.59 +0.32 +0.10 +0.18 -0.62 -0.21 -0.47 -1.01 Systems & Hardware (13) +1.31 +0.60 +0.03 +0.38 +0.02 -0.83 -0.52 -0.36 -0.63 Life Sciences & Medicine (12) -0.04 +0.47 -0.02 -0.02 -0.17 +0.05 -0.24 +0.07 -0.11 Finance, Law & Business (8) +1.07 +0.67 +0.66 +0.13 -0.56 -0.36 -0.46 -0.53 -0.63

Mean within-task z per domain. Red is relatively strong, grey relatively weak.

Opus 5 has its largest relative advantages in Systems & Hardware, Optimization, and Finance, while GPT-5.6-sol has the highest domain mean in Physical Sciences. Life Sciences & Medicine shows no consistent model-level advantage in this aggregate: most domain means remain close to zero, although differences on individual tasks can still cancel when averaged.

Domain averages describe where systems are relatively strong, but they do not show whether improvements selected on visible data survive the hidden-set evaluation. We examine that transfer next.

Visible-to-hidden transfer

Agents select changes using feedback from the visible set, whereas the final method is graded on the hidden set. For the 37 tasks whose visible-set and hidden-set outcomes are both available on the same 0–1 scale, the figure compares each model's mean visible-set score with its mean hidden-set score. The percentage at right is the decrease relative to the visible-set mean; blue marks the visible-set result, red the hidden-set result, and the connecting bar the gap.

0.30 0.35 0.40 0.45 0.50 0.55 GPT-5.6-sol −12.9% Opus 5 −13.2% GLM 5.3 −14.8% Grok 4.6 −15.9% Gemini 3.7 Flash −24.7% Kimi K3 −11.7% GPT-5.5 −18.6% DeepSeek V4 Pro −16.0% Qwen3.8 Max −15.5% Visible set Hidden set

37 tasks × 9 models, both scores on the same 0–1 scale.

Gemini 3.7 Flash has the largest visible-to-hidden decrease at 24.7%. It ranks fifth by visible-set mean and seventh by hidden-set mean within this 37-task subset. Kimi K3 has the smallest decrease at 11.7% and moves from sixth to fourth; the remaining decreases lie between 13% and 19%. These comparisons concern this shared-scale subset rather than all 88 tasks.

The transfer gap establishes that visible progress cannot be treated as the final result. A separate question is how differently the evaluated systems use time, spend, and output tokens.

Resource footprint

The table places each model-harness pair's mean runtime, recorded spend, and output tokens alongside its mean score. It describes how the evaluated systems used resources; it is not an efficiency ranking.

ModelHarnessMean scoreMean run timeMean spendMean output tokens
Opus 5claude code0.4645.6 h$43288k
GPT-5.6-solcodex0.4334.6 h$53234k
GLM 5.3claude code0.4035.7 h$18273k
Kimi K3kimi cli0.3824.8 h$10134k
Grok 4.6grok0.3671.9 h$14252k
GPT-5.5codex0.3311.7 h$1370k
DeepSeek V4 Proclaude code0.3224.7 h$7508k
Qwen3.8 Maxqwen coder0.3223.4 h$20229k
Gemini 3.7 Flashantigravity0.3092.7 h$9395k

All 88 tasks, one run per model.

The resource columns do not define a single axis of effort. The three highest-scoring systems all run for at least 4.6 hours on average, and Opus 5 and GPT-5.6-sol also have the two largest recorded mean spends. But output volume follows a different pattern: DeepSeek V4 Pro and Gemini 3.7 Flash produce the most output tokens, about 508k and 395k per task, yet both rank in the bottom three by score. GPT-5.5 produces the fewest, about 70k, while scoring above both.

DeepSeek V4 Pro also combines the largest output volume with the lowest recorded spend. Runtime, spend, and output tokens therefore capture different properties of a model-harness pair, including iteration style, provider pricing, stopping behaviour, and task difficulty. Because every model-task pair contributes only one observational rollout, these summaries should not be read as estimates of the causal return to extra budget.

Resource totals show how differently the systems used the evaluation budget, but not what they did with it. We therefore turn from aggregate outcomes to the saved research trajectories.

Trajectory analysis

Three trajectory case studies

Aggregate results show what each rollout achieved, but not how it got there. We first inspect one long rollout step by step, then compare two deliberately selected trajectories from the same model: one that remains below its reference and one that moves beyond it. These cases illustrate contrasting search processes; they are not estimates of how frequently either pattern occurs.

Anatomy of a long rollout

The Scientific Discovery Agent Harness Design task provides an illustrative long-form trace with several distinct phases. In this GPT-5.6-sol rollout, the visible suite mean rises from 0.10 to 0.63 over a 10.5-hour run costing $160.

Each step is a saved version, measured on the full six-instance suite; the shaded band is best-so-far. The hidden-set rerun scores 0.256, normalised 0.45.

  1. 0.0–1.2 hThrow away the agent loop. The inherited scaffold was a stateless ReAct call. It is replaced by a stateful harness: an object registry, a notebook the model rewrites in full each turn, guards that refuse invalid or repeated actions, plus a deterministic search that solves one of the two scenarios outright.
  2. 1.2–5.7 hTake the model out of the other loop. A second deterministic controller: handoffs on a fixed schedule, exact capture of the delayed outcome, then a matched instrument panel on untouched controls.
  3. 5.7–8.6 hKeep the simpler of two ties. Two changes measured exactly level with what they replaced. One was reverted, one kept only stripped down.
  4. 8.6–9.9 hAdd evidence, nothing else. Broader role discovery and two extra field assays as independent controls, worth a few thousandths each.

By the second phase neither scenario consults the language model at all. Most of the next eight hours improves evidence collection and compliance with the task's procedural requirements; the other two score components do not move after hour 5.

This trace shows how a long run can shift from architectural changes to progressively smaller refinements. The two cases below hold the model fixed and contrast a search that stays within one approach with a search that eventually changes the structure of the method.

A careful search within one approach

The Small-Model Math Reasoning Post-Training task provides the first contrasting trace. GPT-5.6-sol produced 41 versions and received a hidden-set score of 0.225. A post-training expert read the full log. The run is careful and almost entirely spent on one idea.

Where the 41 versions went: the first student model is trained at v21.

Teacher mode v0-v3 · 4Data hygiene v4-v16 · 13Corpus build v17-v20 · 4LoRA sweeps v21-v37 · 17Package v38-v40 · 3
VersionsWhat the run didWhere it got to
v0-v3Chose the teacher modenon-thinking traces finish 114/128, thinking 16/128
v4-v16Cleaned the corpus and the harnesssplits, deduplication, EOS supervision, an 8-CPU budget
v17-v20Built the training corpus13,450 traces from an answer-blind prompt
v21-v37Swept LoRA ranks, checkpoints and mergesbest reserve 119/512 = 23.24%
v38-v40Merged and queried the visible set3/30 = 10%

Against the reference methodBelow

ReferenceOn-policy distillation4 / 60
This runSupervised fine-tuning only3 / 60

Why it fell short

  • It never left SFT. On-policy distillation is what the reference does, and it is the one direction this run considered and dropped.
  • Eight hours on one idea. Larger corpora and harder LoRA sweeps, no second approach.
  • One measurement over-read. 53/128 against 37/128 became a hard cap near 2,048 tokens, shortened further later, which cost quality.

The expert found no fault with its rigour: the validation reserve was protected until selection was done, every requirement met. The discipline simply served a single idea.

TPU v6e Masked GQA Kernel Optimization

GPT-5.6-sol, 145 versions, hidden-set score 0.708. The first 23 versions tune the official kernel to 7.2×; the remaining 120 build a Pallas kernel of the run's own, and reach 9.76×.

VersionsWhat changedBest visible speedup
v0Inherited plain-XLA baseline0.998×
v1Official SplashAttention, dropped in unchanged0.746×
v2-v23Tile size chosen per mask family; batch folded into the head grid7.775×
v24-v78Two query heads packed per block; sequence-minor K for causal majors9.262×
v79-v118Scratch buffer dropped, accumulator normalised in place9.560×
v119-v145Causal call split into a static prefix and a masked tail9.758×

Against the reference methodBeats it

ReferenceOfficial Pallas splash-attention kernel3.27–14.80×
This runA Pallas kernel of its own4.23–24.25×

Why it got past

  • Using the library is not enough. Dropped in unchanged it scores 0.746×, slower than the plain baseline.
  • Tuning it tops out near 7.8×. That is the ceiling of the reference approach.
  • The last 2× is new structure. Head packing, a scratchless schedule, a causal prefix decomposition, none of which the library expresses.

Together, the two deliberately contrasted cases show why RSI-Exam records both outcomes and trajectories. Sustained experimentation alone does not explain the difference: in these examples, the decisive distinction is whether the search remains within a single approach or develops a structurally stronger method.

Conclusion

Conclusion and limitations

RSI-Exam turns recursive self-improvement from an abstract capability claim into an executable, reproducible research loop. An agent inherits a working method, repeatedly proposes changes, tests hypotheses, retains useful versions, and rolls back failed ones. The final method is then re-executed on the hidden set; only improvements that survive beyond the development environment contribute to its score. In this way, RSI-Exam measures improvement within a bounded, executable research setting.

Limitations and next steps

Data availability

Data availability

Each RSI-Exam 0.1 task has a page carrying the instruction given to the agent, the saved method versions and their change descriptions, and the hidden-set results available for the evaluated models.

Those pages are derived from the underlying task definitions and rollout records. The release artifacts store the resolved model configuration, run record, version history, and verifier output for each available model-task pair. Every figure in this post is computed from the RSI-Exam 0.1 records and the pages generated from them.

The contribution guide explains how researchers can propose a task from their own field, review an existing task, or contribute domain expertise to a future release.

Citation

How to cite RSI-Exam

RSI-Exam Team. (2026). RSI-Exam: Benchmarking Recursive Self-Improvement through Executable Research.

BibTeX
@misc{rsi-exam-2026,
  author = {{RSI-Exam Team}},
  title  = {RSI-Exam: Benchmarking Recursive Self-Improvement through Executable Research},
  year   = {2026},
  url    = {https://github.com/aiming-lab/RSI-Exam}
}